The Declining Driving Miles Intensity of GDP

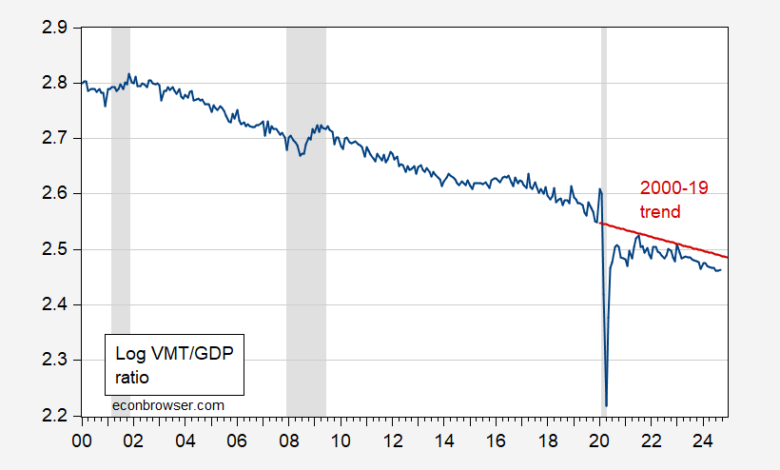
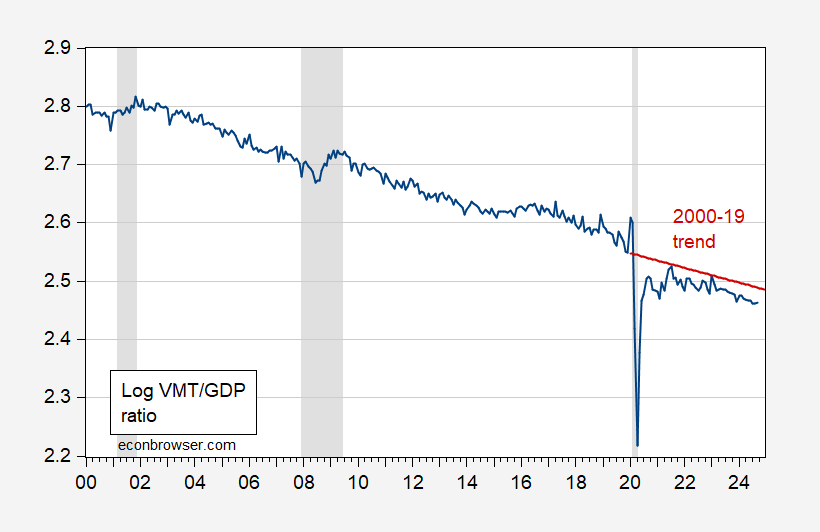
Trend shifted down, but sensitivity up.
Figure 1: Log of ratio of vehicle miles traveled to monthly GDP (000’s miles divided by bn.Ch.2017$ SAAR) (blue), and 2000-19 stochastic trend (red). NBER defined peak-to-trough recession dates shaded gray. Source: NHTSA via FRED, SPGMI, NBER, and author’s calculations.
Nonoverlapping log differenced q/q monthly GDP regression on log differenced VMT has a adj-R2 of 0.03 pre-pandemic, and 0.31 post pandemic (coefficient rises from 0.14 to 0.23).
Given the structural break, it’s unclear how reliable VMT is a leading or contemporaneous indicator of recession (historically, VMT, gasoline consumption, and petroleum consumption all predicted the recession of 2022H1).
Source link


