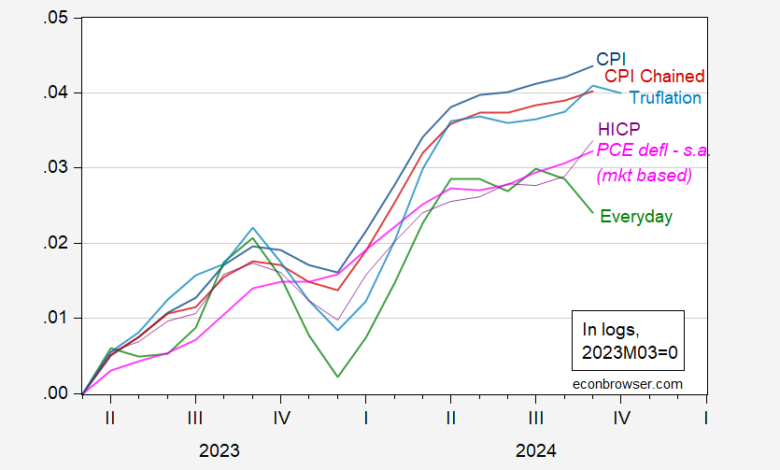
Everyday Price Inflation at 0.3% y/y?

Versus 2.4% for the CPI (in logs). Lots of people think the government’s statistics understates the true inflation rate. It used to be John Williamson at ShadowStats. Now it’s EJ Antoni at Heritage Foundation (who touts the use of Primerica’s everyday price index). But the American Institute for Economic Research’s “Everyday Price Index” (EPI) says otherwise (over the past year and a half).
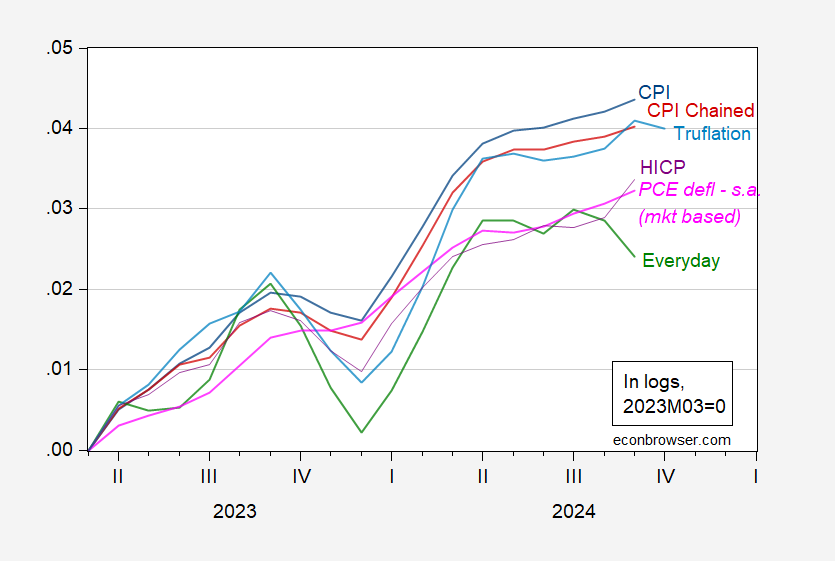
Figure 1: CPI (blue), chained CPI (red), HICP (purple), EPI (green), Truflation (light blue), all not seasonally adjusted, and PCE deflator – market facing, seasonally adjusted (pink), all in logs 2023M03=0. Truflation index measured at last day of month. Source: BLS, European Commission via FRED, Truflation, AIER.
AIER’s EPI tries to tabulate, like it says, every day expenses, taking out prices of those goods and services that are postponable. Truflation taps into big data to produce high frequency estimates of the cost of living (documentation here).
Source link


