Alternative Estimates of Q4 Output
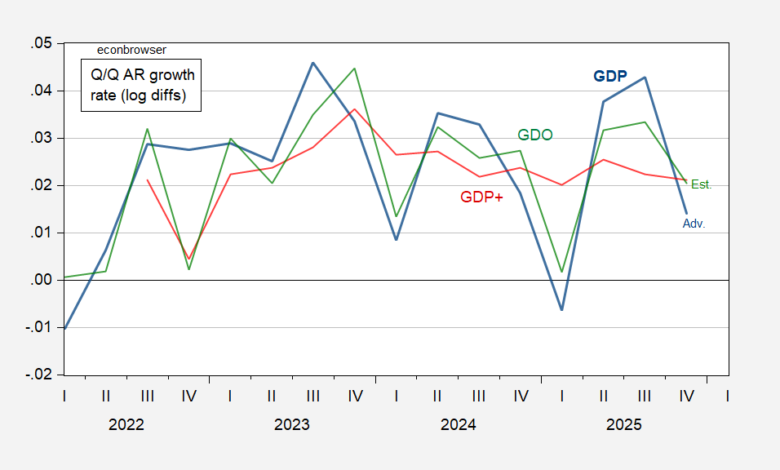
GDO and GDP+.
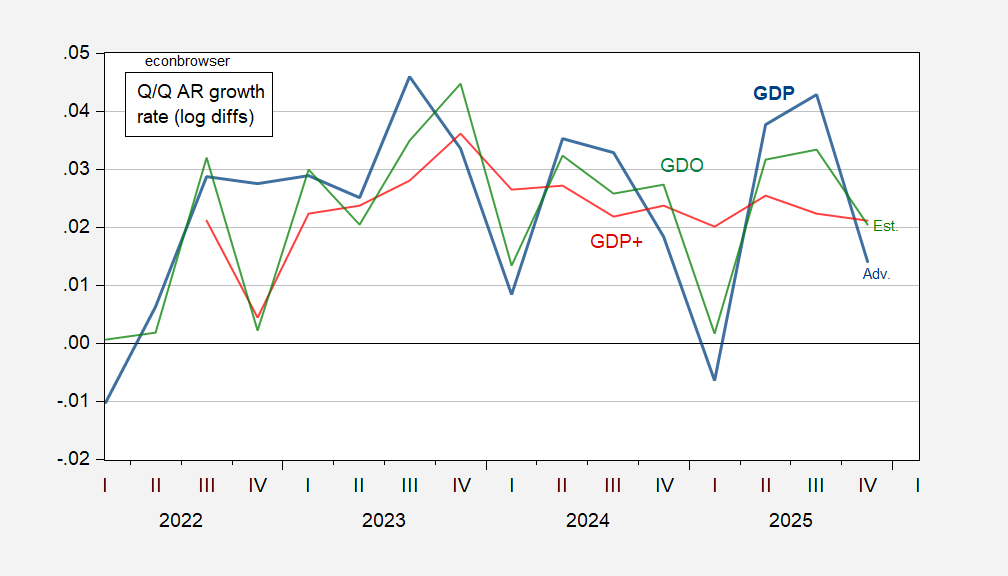
Figure 1: GDP advance (bold blue), GDP+ (red), GDO estimate (green), all Q/Q annualized growth rate, calculated as log first differences. GDO calculated based on estimated net operating surplus for 2025Q4, forecasted using first differences regression on constant, 2021Q1-25Q3. Source: BEA, Philadelphia Fed, and author’s calculations.
In recent quarters, the net operating surplus (the missing piece for GDI) has been fairly smooth, so I use a simple extrapolation using first differences.
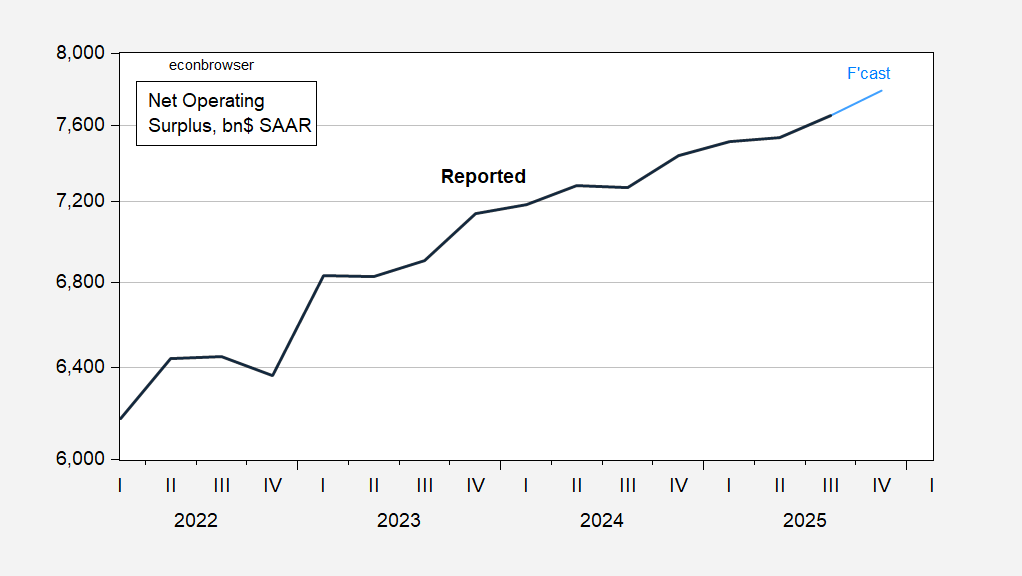
Figure 2: Net Operating Surplus (bold black), projected (red), both in billions $, SAAR. Source: BEA 2025Q3 advance, and author’s calculations.
Estimating an AR(1) on log levels produces a downward move in projected net operating surplus.
GDO and GDP_ suggest 2% q/q AR growth in Q4; nowcasts for GDP in 2026Q1 are 2.4% (NY Fed), 3% (St. Louis Fed), 3.1% (GDPNow), and 3.4% (Goldman Sachs tracking estimate).
Source link