Annotated Graph of SP500 and Dollar
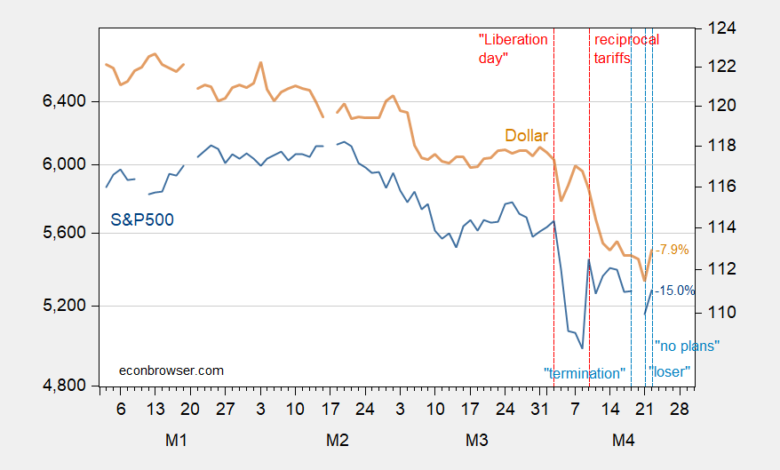
Including “Liberation Day” and “termination”, down 15%, and 7.9% (log terms) relative to post-inauguration peaks (through 4/22 close).
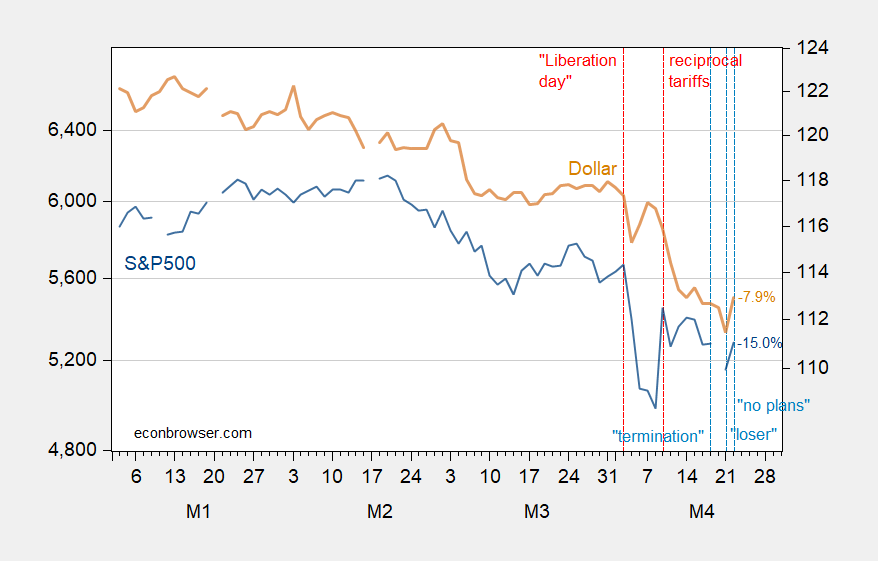
Figure 1: S&P500 (blue, left log scale), and nominal dollar against advanced country currencies (tan, right log scale). Last two days of dollar use dxy spliced to Fed measure. Source: FRED.
Source link